
Master Class
Essential Reporting Knowledge

Introduction
The SG JasperSoft Reports server is installed on a customer’s central server when V5 Traceability is first initialized. This reports server can then be accessed from any PC connected to the central server’s network, allowing managers and supervisors to generate reports as needed.
Reports can be used to view a wide variety of system information, and are essential to the functionality of V5 Traceability. This section of our website will look at how we run reports and will cover the wide variety of reporting options available.
Table of Contents
1. Accessing Reports
Once installed, reports can be accessed via any device’s web browser, provided that device is connected to the same network as the reports server.
The URL for reports will usually be something like the following:
http://SERVER IP ADDRESS:8080/jasperserver/login.html
We would just have to insert the central server’s IP address where indicated to be brought to the reports login screen. If this doesn’t work then it is possible that reports were installed using a different network port. In these cases please contact your system admin, or SG Support for help connecting.
Reports can also be accessed through Control Center, using the ‘Reports’ button under the ‘Reporting’ header.

If this doesn’t work correctly, please contact SG Support, who will be able to make the appropriate changes to the Control Center’s configuration file.
Once we managed to connect to the reports server, we will see the login screen.

The default user account here will always be set to:
Username: sguser
Password: sguser
Quite often, the URL set for Control Center access will bypass this login stage and take us straight to the reports home page. Let’s look at this now.
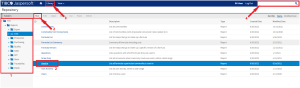
Once here, we can browse reports using the categories on the left side of the screen (1). We can then run a report either by clicking on it in the reports list, or by highlighting the report’s line and clicking ‘Run’ in the top panel (2).
We can also view a list of all available reports by using the ‘Library’ button (3), or search for a specific report using the search tool in the top right of the window (4).
We can now look at each individual report and what options are available for them.
2. Links in Reports
Many reports featured within the SG Systems JasperReport suite feature links that can take the user to additional reports that are generated based on the link they click. If links are present in a report, the user will see their mouse cursor turn into the ‘finger point’ version of the cursor as they hover over a particular field.

If the user then clicks this field it will generate a new report. In this case we are looking at a ‘Formula List‘ report, so clicking this particular commodity here will generate a new ‘Used In‘ report for that commodity.
Note that clicking these links will close the currently open report to generate the new one.
Each report guide featured here will contain a final section to inform the user of which links are possible from the current report.
3. Reports Index
More to Follow!
Additional reports guides are constantly being added to this page!
4. Scheduling Reports
As well as running reports as described in the guides above, we can also schedule reports to run once or at regular intervals. These scheduled reports can be saved to a users computer, sent to an FTP server, or emailed out to the relevant managers or supervisors to help improve their time management and workflow. More information on how to do this can be found in our ‘Scheduling Web Reports‘ guide.