
KPI
Key Performance Indicators for your Business!

New from SG Systems, the V5 KPI Dashboard transforms data into actionable insights with dynamic visual representations of critical metrics, keeping you competitive in any manufacturing environment. The key benefits of this are:
- Operational Efficiency: Real-time data identifies bottlenecks and optimizes processes.
- Production Control: Accurate and consistent production with detailed status monitoring.
- Informed Decisions: Up-to-date KPIs empower better strategic planning.
- Cost Reduction: Minimize waste and improve inventory turnover with precise tracking.
V5 KPI Dashboard transforms data into actionable insights with dynamic visual representations of critical metrics, keeping you competitive in any manufacturing environment.
Table of Contents
1. Installation & Login
Similar to the V5 Reporting Suite and API package, the V5 KPI is installed as a Windows service using Apache Tomcat to host it on a customer’s server. From here, again similar to the reports, the V5 KPI can be accessed by any user connected to the network via a standard internet browser.
The connection format for this would be “http://IP Address:Port #/kpi”, so in this case we will be looking at a locally installed instance of the KPI, so we will connect via “http://127.0.0.1:8181/kpi”.
Once we connect to the KPI service we be asked to log in.
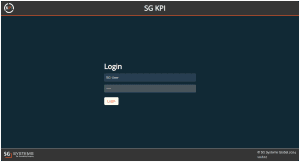
We would log in here using the same username and 4 digit PIN that we would use to log on to any of the other V5 applications.
Once logged in we will see the main KPI page view.
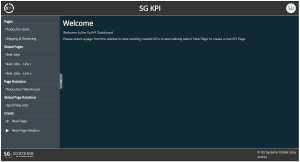
We can take a look at this layout in greater detail below.
2. KPI Layout
Once logged in to the V5 KPI, we can take a look at the general layout and see where our various functions are located.
We can look at these areas as follows:
- User options – we have a variety of options under this menu here, including visual options for using the application, as well as being able to define the order of the various types of saved KPI pages on the left hand side of the screen.
- Saved KPI Pages – This area will contain all KPIs that are viewable to the logged in user. These include:
- Pages – Pages created by the logged in user.
- Global Pages – Any global pages created by any KPI user.
- Page Rotations – Page rotations created by the logged in user.
- Global Page Rotations – Any global page rotations created by any KPI user.
- ‘New Page’ buttons – Allows the user to create KPI pages or page rotations.
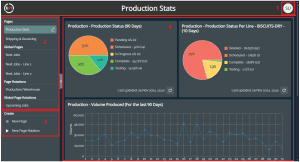
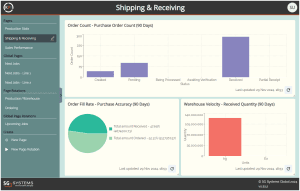
- Viewing Area – in this area we will see whichever KPI page that we have selected from the ‘Saved KPI Pages’ list above. So here we have our ‘Production Stats’ KPI page visible.
3. KPI List
The list of KPIs currently available are designed to cover the 4 main areas of any production/manfacturing facility, Receiving, Shipping, Inventory Management, and Production. We can explore these by category below.
- Purchase Planning – Shows ordered quantities for Purchase Orders, sorted by units.
- Purchase Order Count – Shows number of Purchase Orders in the system, sorted by the order status.
Learn more about this KPI here. - Received Quantity – Shows received stock in the base unit of the system – unless 0 unit conversion is set (for boxes etc.), sorted by units.
- Purchase Accuracy – Shows total amount ordered vs amount received.
- Sales Planning – Shows ordered quantities for Sales Orders – sorted by units.
- Sales Order Count – Shows number of Sales Orders in the system, sorted by the order status.
- Learn More about this KPI here.
- Shipped Quantity – Shows shipped stock in the base unit of the system – unless 0 unit conversion is set (for boxes etc.), sorted by units.
- Sales Accuracy – Shows total amount ordered vs amount shipped.
- Space Used – Compares stock locations that are in use vs empty ones.
Learn more about this KPI here. - Unused Inventory – Total number of lots of any materials that are not expired and haven’t been used within the set number of days.
Learn more about this KPI here. - Inventory Accuracy – Cycle Counting results, sorted by accurate vs corrected counts.
- Manufacturing Performance – Compares the run time set against formulas within the system to the achieved time when physically produced.
- Next Jobs – Shows a set number of upcoming jobs across all production lines.
- Learn more about this KPI here.
- Next Jobs Per Line – Shows a set number of upcoming jobs, filterable by production line/location.
- Learn more about this KPI here.
- Production Accuracy – Shows a % accuracy of scheduled quantity vs produced quantity.
- Production Giveaway Per User – For batches, shows % accuracy for target vs achieved quantity – filterable by user.
- Production Giveaway Per Line – For batches, shows % accuracy for target vs achieved quantity – filterable by production line.
- Production Status – Shows total number of jobs, listed by status.
- Production Status Per Line – Shows the total number of jobs, but with filtering available to view by production line.
- Volume Per Line –Finished goods produced over time, but filterable by production line.
- Volume Per User – Finished goods produced over time, but filterable by user.
- Learn more about this KPI here.
- Volume Produced – Finished goods produced over time.
4. Creating a KPI Page
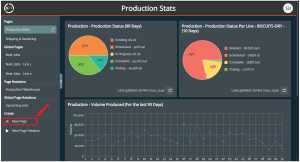
We can see above that we already have some KPI pages created and saved, but let’s take a look at how we can create a new KPI page to go along with these.
We would start here by clicking the ‘New Page’ button on the left hand side of the screen.
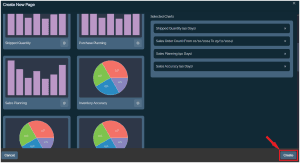
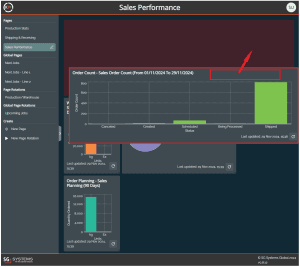
After which we will be taken to the KPI creation screen. We should first enter a name for our new KPI page (1 – required). Let us imagine here that we are creating a KPI page for a Sales Manager, so we will call it ‘Sales Performance’.
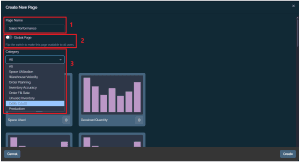
The category drop-down menu (3) can then be used to filter available KPI pages by their function, or we can scroll through all the available KPIs if we scroll down through the page. Since we are creating a page for our Sales Manager, we will select the following KPIs for them:
- Sales Planning
- Shipped Quantity
- Sales Order Count
- Sales Accuracy
Once we have found the KPIs we want to add, it is simply a matter of clicking the ‘+’ icon for each desired KPI. Once this has been hit, then we wil be shown the individual KPI’s parameter options, such as here for ‘Shipped Quantity’.
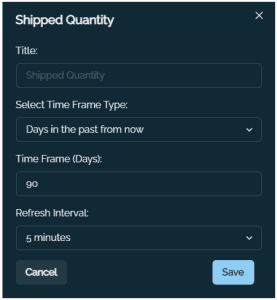
So we can see here that we can rename the KPI if desired, as well as having the option of searching via days in the past or using a specific date selection. We can also set a refresh interval which specifies how often the KPI page will refresh to included updated data from the live SG database.
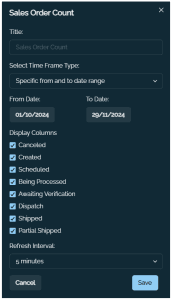
Other KPIs such as the ‘Sales Order Count’, provide more options for what data they will display, such as in this case being able to specify which order statuses we want to see on the KPI. A full breakdown of parameters for each KPI is featured below! In this case let’s use the date filter instead of specifying days in the past:
We will see that, as we are adding KPIs and then saving their setup, they are added to a list on the right hand side of the screen.
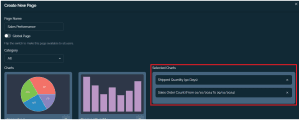
We can continue to add as many (or as few) KPIs as we would need here, before clicking on ‘Create’ create our new KPI page.
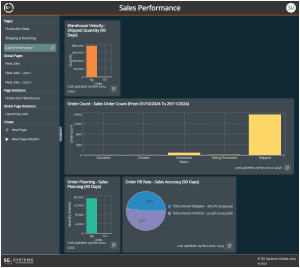
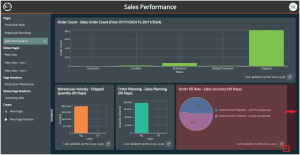
We will then be returned to the main KPI screen, and our newly created KPI will now be visible.
5. Editing a KPI Page
Once a KPI page is created, we have the ability to edit it, giving us the ability to add/remove KPIs, as well as changing their parameter settings if desired. This can easily be done by clicking the ‘Edit’ button for the relevant KPI. So let’s edit the KPI we have just created.
Note that global pages can only be edited by the KPI user that created them.
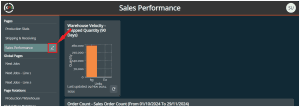
Once we have clicked this we will be taken to the ‘Edit Page’ area for the KPI that we wish to edit.
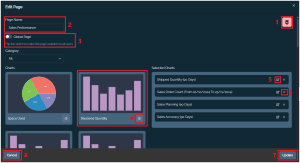
Here we have the following options for editing KPIs, where we can:
- Delete the KPI, which will remove it from our list of saved KPIs on the main homepage
- Rename the KPI
- Switch the KPI page to be a global page.
- Add new KPIs
- Edit the parameters of a KPI that is already a part of our page
- Remove a KPI from our page
- Save any changes that we have made
- Cancel any changes that we have made and return the KPI homepage with the same KPIs/settings for our page
6. Resizing/Moving KPIs
Once we have created a custom KPI page with all the information that we need, we then have the option to drag and drop, as well as resize each KPI window to create a customized view that is best suited to an individual’s workflow.
Drag & Drop
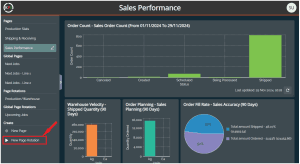
To drag and drop a KPI, all we need to do is click and hold in a neutral area of the KPI (so not over any of the generated graphs/the refresh button/the resieze button (see below) and drag it into a new position. A red shaded area will indicate the space that the KPI will be dropped into.
Existing KPIs will automatically move to best make space for the KPI we are moving.
Resizing
Resizing can be done simply by clicking and dragging the arrow icon in the bottom right corner of each KPI.
Again a shaded red area will indicate the space that the resized KPI will occupy.
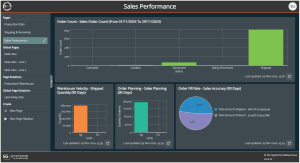
With these 2 adjustments made we have now created a more personalized view of our ‘Sales Performance’ KPI that we first created.
7. Creating a Page Rotation
As we touched on above, the V5 KPI features a ‘Page Rotation’ feature, which is ideally suited for large scale production monitors throughout a production facility. Let’s see how we can set these up.
Page rotations make use of existing KPI pages, so we must have at least 2 of these already present before we can create a page rotation. The same is true for global page rotations.
Note that it is not necessary for global pages to have been created by the logged in user in order for them to be used for a new global page rotation.
To start creating a new global page rotation we will click the ‘New Page Rotation’ in the ‘Create’ section on the left side of the page.
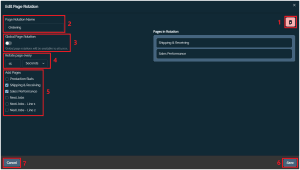
In the next screen we will see the options for creating a new page rotation.
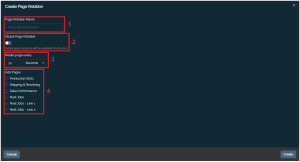
So here we can name our rotation (1 – required), and decide whether we want this rotation to be a global page rotation or not using the slider (2). Note that only global pages can be a part of a global page rotation, and that using the slider will change the display to only show existing global pages.
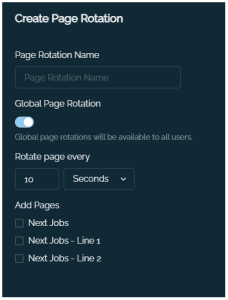
We can also specify the page rotation time (3), setting the time each page will be shown before going to the next.
Finally we will specify the pages to include in our new rotation. We will set up a new page rotation using the following settings:
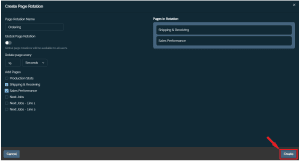
And then hit ‘create’ in the bottom right to save our new rotation.
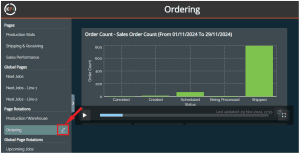
Once back in the main KPI window, we can then select our newly created page rotation (1), and then play it (2), and make it fullscreen (3 – ideal for use with larger displays).
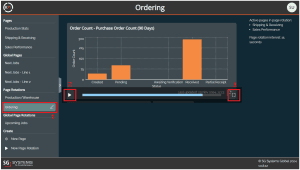
Note that graphs will stretch to fit the resolution of the display.
8. Editing a Page Rotation
Once a page rotation is created, in a similar way to the KPI pages themsevels, we have the ability to edit them. This can easily be done by clicking the ‘Edit’ button for the relevant page rotation. So let’s edit the one we have just created.
Note that global page rotations can only be edited by the KPI user that created them.
Once we are into the editing window, we have similar options to editing a KPI page that we saw above:
So our editing options here are:
- Delete the page rotation, removing it from our home page.
- Renaming the page rotation.
- Toggling the rotation to be global or not.
- Changing the rotation interval.
- Add or remove KPI pages from the page rotation.
- Saving our changes and returning to the main page.
- Cancelling our changes and returning to the main page.
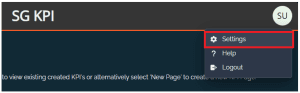
9. User Settings
9.1. Viewing Modes
We also have additional accessibility/viewing options to further customize a user’s viewing experience while using the V5 KPI. These can be accessed via clicking on the user icon in the top right of the KPI page.
The first of these is a choice of light and dark modes (dark mode is enabled by default)
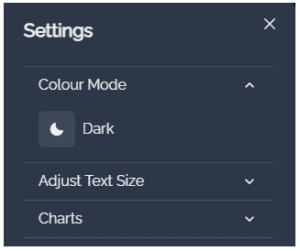
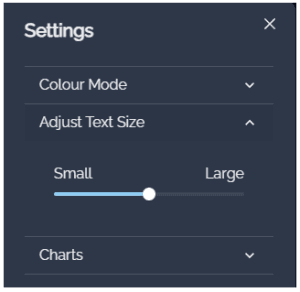
The second is a slider to increase or decrease text size, useful for viewing KPIs on larger or smaller displays, depending on where they are being displayed.
Once we have decided on our setup here, we can save any changes at the bottom of the screen, and changes will be made immediately. We can see an example of the KPI view with ‘Light’ mode selected below.
9.2. Page Order
The settings menu also contains options for rearranging the order of our saved KPI pages and page rotations. We would need to have some KPI pages or page rotations created for these options to be visible in this menu.
Note that order changes to global pages or global page rotations will be reflected for all users.
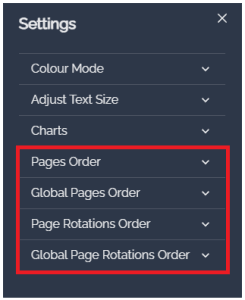
Opening the settings menu here we can see the page viewing options available. This is based on how many pages, and of what type, we have available. So in this case we can see all categories of pages:
So in this case let’s change the order of one of our regular KPI pages:
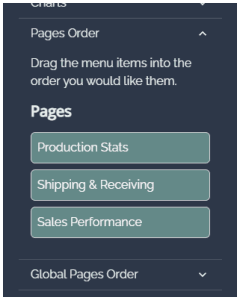
Here we can simply click and drag our pages to change the order that they will be displayed:
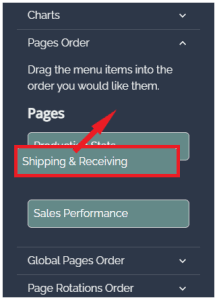
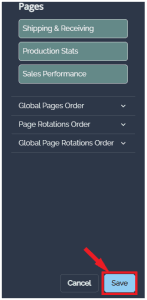
We can change the order of any other pages/global pages or rotations here, and when we are happy with the changes, we can click ‘Save’ at the bottom of the page to save any changes.
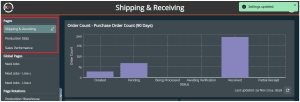
After which we will see our changes reflected on the left hand side of the home screen.
9.3. Avatars
One final change that we can make to the KPI to personalize it for each user is to add a user avatar/image. By default this will simply display the user’s initials in the top right of the main screen (where we would access the user options seen above), so here we have ‘SU’ for ‘SG-User’.

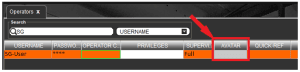
To change this we would need to open Control Center and navigate to the ‘Operators’ screen under the ‘Setup’ category. Here there is an ‘Avatar’ field.
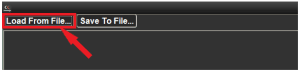
Clicking this field will open another window where an image can be selected by using the ‘Load From File’ button to select an image on the local computer’s storage.
Once an image has been selected it will load into the window we just opened. Here we will just use a generic user image.
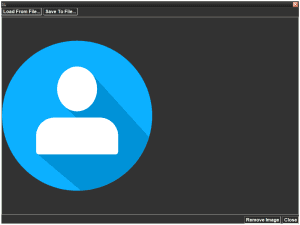
This window can now be closed in the bottom right of the screen. When we next log in to the V5 KPI after adding this image we will see our new avatar in place.

Avatars can be changed or removed from Control Center as required.
10. Messaging
With the release of the v5.9 of Control Center, it is possible to sent messages and alerts to KPI users. More information on how this works can be found in our module guide here.